📍 What we capture

  • City/Region from the scan event (privacy‑safe granularity).
  • Time & device type to understand usage patterns.
  • No precise GPS is required for normal verification.
Privacy‑aware Real‑time Lightweight

🗺️ How it’s used

Your dashboard highlights scan locations and flags abnormal patterns:

  • Too many scans in a long time window.
  • Scans appearing far from expected markets.
  • Repeated scans of the same QR (possible code reuse).

Location Overview

Geolocation heatmap placeholder

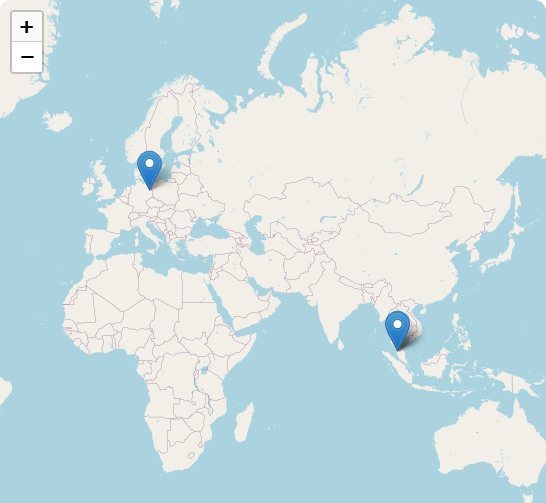
* This is a placeholder image. Your dashboard will show live city/region heatmaps with scan counts and timestamps as well as the address for the current month.

Recent Scan Locations

Geolocation data placeholder

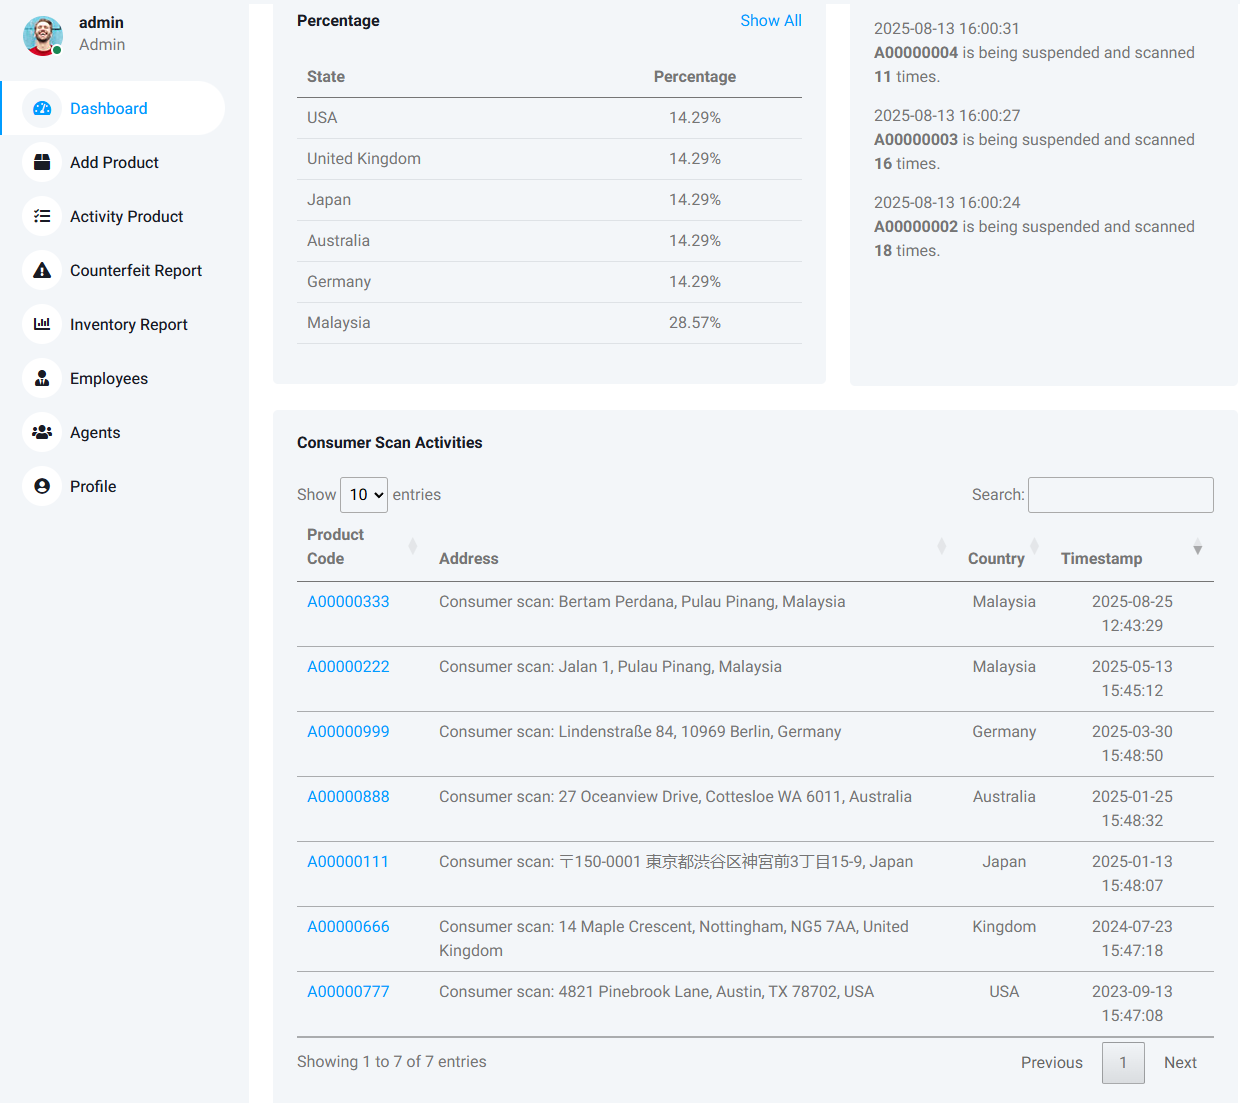
* This is a placeholder image. Your dashboard will show live city/region counts with the timestamp of the last scan for each code.

* This is just a sample data. Your dashboard will list the details of the data based on the data stored in the database.

🚨 Abnormal Activity Rules


Rapid scans

If a single code is scanned repeatedly after a period of time, flag as potential reuse.

Far‑away clusters

If scans appear in regions where the product isn’t sold, mark as unusual.

Volume spikes

Sudden jumps in a city/region trigger a review to catch counterfeit flows.

🔒 Privacy

  • We store city/region and event metadata only (no precise GPS for standard scans).
  • Data is used for security and operational insights (e.g., alerts, simple reports).
  • Retention follows your policy settings and applicable regulations.

Need a custom retention window or data export? We can configure it per account.